Analysis
Does Copying Congress's Stock Trades Actually Work?
Politicians file their stock trades in public records, and whole apps exist to help you copy them. I collected every disclosed trade from the House and Senate over eleven years and built a fair test of whether following them makes you any extra money.
45,089 trades · 2015 to 2026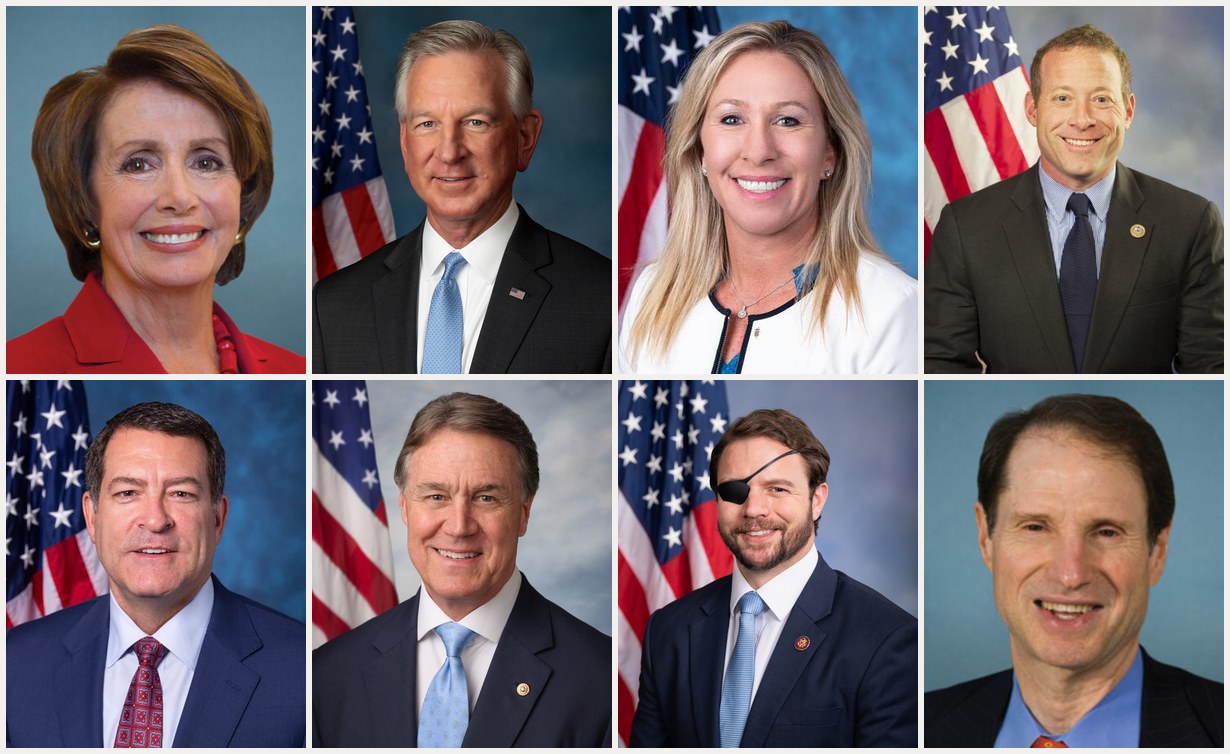
Official congressional portraits, public domain, via the unitedstates/images project.
You have probably seen the pitch. Members of Congress somehow keep beating the market, so just copy their trades and beat it too. There are apps built on this idea, an ETF that does it for you, and a steady stream of posts about Nancy Pelosi's portfolio. Congress members have to report every stock trade they make, so the data is public. It sounds like free money.
I wanted to know if it actually works. So I built the whole thing from scratch: I pulled all 7,598 House disclosure filings and 2,416 Senate filings from 2015 to 2026, parsed them into 45,089 individual stock trades, matched them to market prices, and tested the strategy the way you would actually have to trade it. You can only copy a trade once the filing becomes public, which is about four weeks after the politician traded. So my test buys at the next market open after each filing goes up.
The trick is asking the question fairly
Here is the problem with every viral "Congress beats the market" chart. Politicians mostly buy huge famous companies: Microsoft, Apple, Amazon, Nvidia. Any big pile of those stocks crushed the market average over the last decade. That is not stock-picking skill. That is just owning big tech during a big tech bull run.
So instead of comparing Congress to the market, I compared each trade to a stand-in picked by a random number generator. Every time a politician bought a stock, my computer also "bought" 100 random stocks drawn from the same sector, with the same level of popularity among members, on the exact same day. Think of it as rolling dice that are loaded exactly the way Congress's portfolio is loaded. If politicians really know something, their actual pick should beat their look-alike picks.
Eleven years of data and the two lines are nearly the same line. A dollar in the real picks grew to $5.14. A dollar in the random picks grew to $4.62. That gap works out to about 0.9% a year, and it is small enough to be plain luck. The honest reading of the bottom panel is a coin flip that has drifted a little in Congress's favor lately, not a money machine.
But what about the inside information?
The usual objection: by the time a filing is public the trade is a month old, so the juice is already gone, and the politicians themselves are the ones getting rich. The data lets me test that too. I reran everything as if you could impossibly copy each trade on the day the politician actually made it, with zero delay.
The result: 0.3% a year over the random picks. Basically nothing. Even the politicians themselves, trading on whatever they know the day they know it, do not beat dice loaded like their own portfolios. The delay is not hiding an edge. There is no edge to hide.
Okay, but is one specific politician worth copying?
This is the version most people actually believe. Not "copy all of Congress," but "copy that one." So I gave all 133 politicians with at least 20 stock purchases their own report card: their picks against their own random look-alikes.
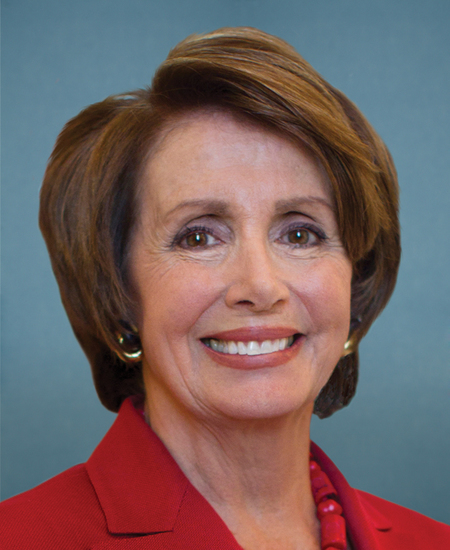
A genuinely great run. Still inside the luck zone, and her famous wins were options the filings do not let you copy.

The single best record in Congress. My luck simulation produces records like this from random picks.
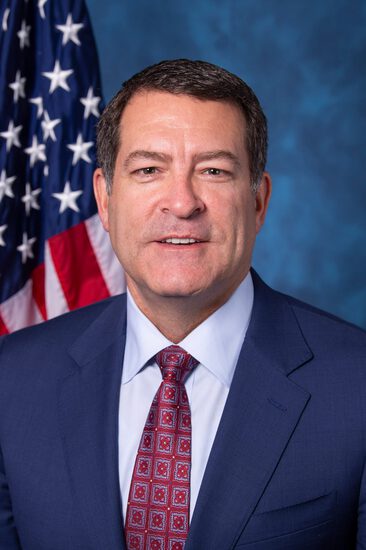
One person is about half of the famous big-trades-win statistic. Remove him and it mostly disappears.
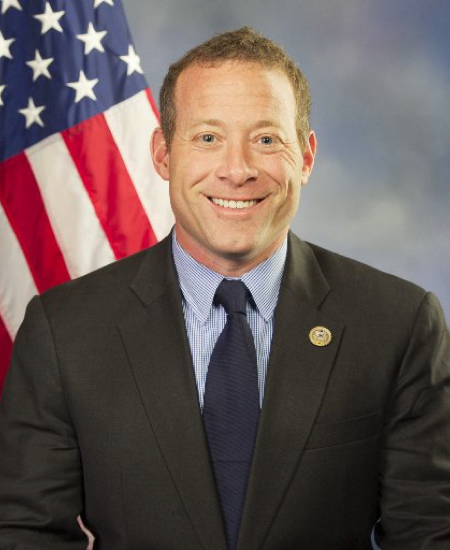
Trades constantly, mostly Microsoft. Ends up looking like an index fund with extra steps.
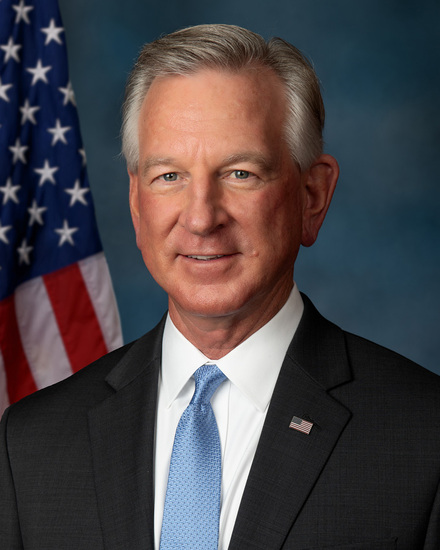
One of the most copied names in the apps. Slightly behind the dice.
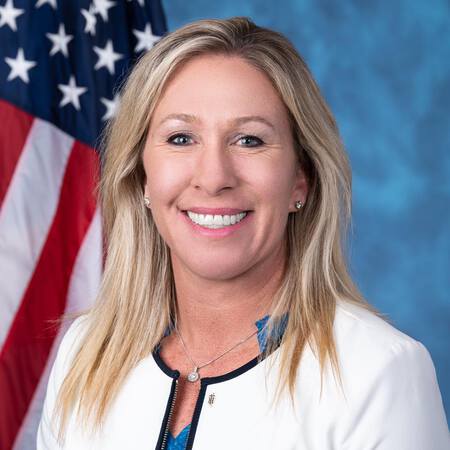
Hundreds of trades, headlines every quarter, and worse than random picks.
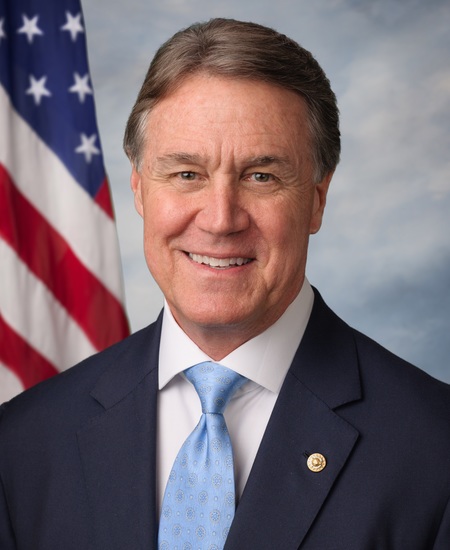
The single most active stock trader the Senate has had. Dead even with the dice.
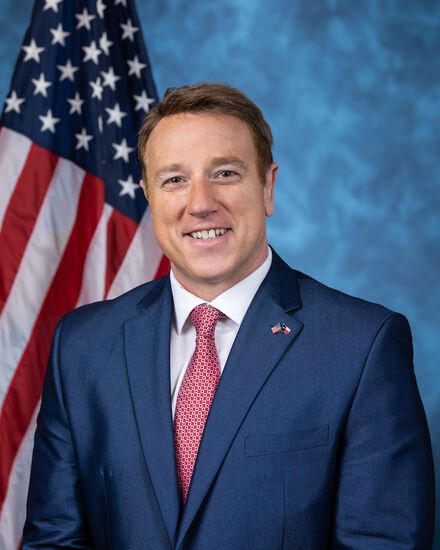
The cautionary tale. The worst record in the study.
Some of those numbers look exciting until you ask one more question: what would this list look like if every politician picked stocks at random? With 133 people, someone always ends up with an amazing record by pure chance, the same way someone always wins the office March Madness pool. So I simulated exactly that, 100 times: the same 133 politicians, the same trade dates, the same sectors, but every pick replaced with a random one.
The real line lives inside the luck band the whole way, including at the top. The best real record in Congress is right where the best fake record lands in a typical simulation. After standard corrections for checking 133 people at once, the number of politicians with proven skill is zero.
Three real patterns I did find
The strategy does not work, but the data is not boring. Three patterns are genuinely there. None of them is money you can collect, but each says something about how this world works.
1. Fast filers do better. Late filers do worse. Trades disclosed within a couple weeks go on to beat their look-alikes a little. Trades filed months late, often past the legal deadline, go on to lose to them. You cannot trade this, because a late filing is late by definition. But it is a real pattern in who follows the rules.
2. The giant trades look better, but it is mostly a few people. Purchases of $250,000 or more beat their look-alikes by a wide margin on paper. Then you look closer: about half of that entire effect is Mark Green's trades, and if you remove the six most active big traders the whole thing drops to zero. A handful of people had hot streaks in a handful of stocks. That is a story, not a strategy.
3. Since 2023, filings move prices a tiny bit. In the first week after a filing becomes public, the stocks in it now drift up about a quarter of a percent relative to their look-alikes. That never used to happen. It is probably the copy-trading crowd itself pushing prices, though weirdly the effect is missing in the famous names people actually follow. Either way it is pennies, and it shrinks the moment too many people chase it.
The ETFs already ran this experiment with real money
Two funds will copy Congress for you: NANC follows Democrats and GOP follows Republicans, both run by Subversive Capital with Unusual Whales. They launched in February 2023, so they are a live test with real dollars and no hindsight.
NANC returned 109% through August 2026, which sounds great next to the S&P 500 at 97%, and that is the comparison its fans quote. But NANC is basically a tech-heavy index fund, and against the tech-heavy Nasdaq at 140% it looks ordinary. Adjust for what it actually holds and its skill is a rounding error: +0.8% a year, which is statistically nothing. The Republican fund returned 83%, behind the S&P outright.
A note on the ticker, since it trips up most write-ups that quote these funds: the Republican fund traded as KRUZ until 21 March 2025, when it changed its ticker to GOP. Yahoo Finance still serves a stale KRUZ series that stops in July 2026 alongside the live one under GOP. The two agree exactly on all 862 overlapping days, so the figures above use GOP, which runs to the present.
So what is the takeaway?
Copying congressional stock trades is a story that survives on bad comparisons. Measured against the market, politicians look brilliant, because they happen to own the stuff that went up. Measured against dice loaded exactly like their own portfolios, the brilliance disappears: about +0.9% a year, statistically zero, with no delay excuse, no skilled individual, and no rescue from the real-money ETFs.
That does not mean the disclosures are meaningless. They are great data about conflicts of interest, about who files late, and about how attention itself now moves prices a little. They are just not an investment strategy. If the goal is returns, the boring answer wins again: a plain index fund gets you the same ride without pretending anyone in Washington is picking stocks for you.
Sources
Everything below is public. The pipeline downloads and parses it from these sources directly, so any number in this piece can be rebuilt from scratch.
Data
- US House Clerk, Financial Disclosure Reports. The annual bulk archives and every Periodic Transaction Report PDF, 2015 to 2026.
- US Senate, Electronic Financial Disclosure search . 2,416 Senate transaction reports, 2014 to 2026.
- STOCK Act of 2012 (Pub. L. 112-105). The law setting the 45-day reporting deadline.
- Yahoo Finance. Split and dividend adjusted daily prices.
- Kenneth R. French, Data Library. The Fama-French five factors plus momentum.
- unitedstates/congress-legislators. Party, chamber and state for every filer. Portraits from unitedstates/images.
- Subversive ETFs (NANC and GOP). The two funds that implement this strategy commercially.
Method
- Fama, E. and French, K. (2010). Luck versus Skill in the Cross-Section of Mutual Fund Returns. Journal of Finance 65(5). doi:10.1111/j.1540-6261.2010.01598.x. The luck-versus-skill bootstrap behind the per-politician test.
- Romano, J. and Wolf, M. (2005). Stepwise Multiple Testing as Formalized Data Snooping. Econometrica 73(4). doi:10.1111/j.1468-0262.2005.00615.x. The correction applied across the eight pre-registered hypotheses.
- Newey, W. and West, K. (1987). A Simple, Positive Semi-Definite, Heteroskedasticity and Autocorrelation Consistent Covariance Matrix. Econometrica 55(3). doi:10.2307/1913610. The standard errors used on every overlapping-holding series.
How this was built: a Python pipeline that pulls the filings above, matches them to prices, and enters at the next market open after each filing is published, holding roughly three months. Each trade is compared with 100 matched random draws (same sector, same popularity among members, same day, same $5 minimum price). Newey-West errors, Romano-Wolf correction across the eight pre-registered hypotheses, and a Fama-French style luck simulation for the per-politician test. 38 unit tests, including look-ahead guards. Nothing here is investment advice.